|
|
Roadpollution is a software for the analysis of road lighting installations and for the evaluation of their environmental impact in terms of light pollution produced. It provides a detailed report including a large number of parameters which allow to quantify the quality of the lighting design, its effectiveness in energy saving, its correspondence to the requirements for minimizing light pollution and its compliance to laws against light pollution.
Roadpollution is not intended as a lighting design software, even if it computes all typical parameters like average mantained luminance, horizontal, vertical and semicylindrical illuminances, uniformity, glare, luminance/illuminance distributions on the road and much more. For design purposes, specific and certified softwares should be used, together with indispensable optimization software like Easy Light (www.savethesky.eu). Lighting designers can profitably use Roadpollution to check the quality of their design and to experiment how to improve energy saving and light pollution control. When a satisfying design is reached, the report obtained with Roadpollution can be attached to the lighting plan. It constitutes an additional value and it helps the designer to emphasize the good qualities of the lighting installation toward customers, public opinion and environmentalists.
Roadpollution can be profitably used by peoples involved in control of light pollution to check the energy saving and the environmental impact of a lighting installation, based on two fundamental documents which should always follow it: the lighting design and the luminaire’s photometrical data. In lack of the first, input parameters can be obtained with an on-site inspection of the installation. Note that a favorable result of the analysis of a lighting design does not assure that the actual installation is good too. An accurate check of the compliance of a lighting installation with the lighting design should be carried on during the inspection which follows the realization of the installation or when doubts arise about this compliance.
The compliance of a lighting design with laws against light pollution in principle should be verifiable directly on the two cited documents and should not require specific calculations. However, Roadpollution is invaluable to check their consistency and accuracy, to compute missing parameters, to gain wider informations or when the lighting design is unavailable or incomplete. Moreover the Roadpollution report constitutes an useful “identity card” of the lighting installation where all useful parameters are easily found in a uniform form. InstallationRoadpollution requires a PC with Windows XP. It should work also under windows 98/NT/2000 but it was not tested under these OS versions. Roadpollution does not need to be installed. It is sufficient to unzip the file roadpollution.zip inside a directory in the chosen position of the disk. The files with the input photometrical data must be placed inside the same directory, together with the Roadpollution software. An example eulumdat.ldt file is already included for trial purposes.
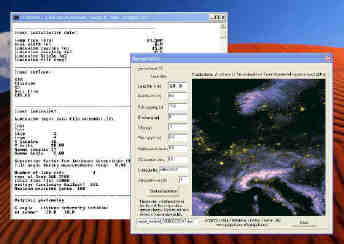
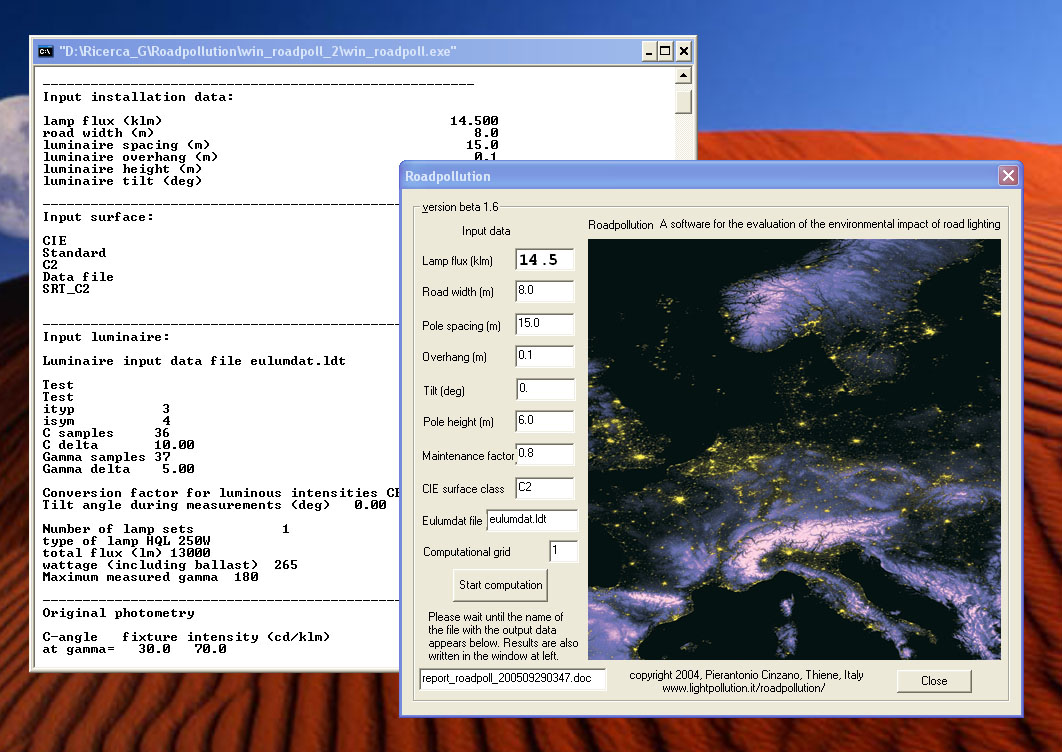
Usage Two windows open. The rightmost window shows the boxes where the input parameters should be written and the button to start the computation. The leftmost window shows the results as soon as the program compute it.
1) Light flux of the adopted lamps in kilolumens. This value can be smaller than the standard output of the lamp when a flux controller is assumed to be active. 2) Road width in meters. 3) Pole spacing in meters. 4) Luminaire overhang in respect to the road border in meters. 5) Luminaire tilt for computation in degrees. The tilt should always be zero in lighting installations careful of minimizing light pollution. However the limits to the upward luminous intensity per unit flux required by some laws against light pollution allow small tilts to some luminaires, so this possibility was included in the software. The tilt is intended “in respect to the position of the luminaire in the photometrical data file”. This position in rare cases could differ from the “suggested position of installation” or from the zero tilt of their optics. 6) Pole height in meters. 7) Maintenance factor, accounting for lamp depreciation etc. 8) Kind of surface according to CIE classification (C1, C2, R1, R2, R3, R4). 9) Name of the file with the input photometrical data in Eulumdat format of the chosen combination of fixture, optics, lamp and lamp position (max 20 characters). See the note in the box below. 10) Computational grid: 1 for italian standard UNI 10439; 2 for CIE Publ. 140 (2000) and european standard EN 13201-3 (2004); 3 for ANSI-IESNA RP-8-00; 4 for a 100 x 50 high resolution grid; 5 to 9 for grids customized by the user by editing the file grid.dat. The computation last from few seconds to some minutes, depending on the grid-size. Roadpollution writes a detailed report in the file report_roadpoll_xxxx.doc . The name contains a numerical code which identifies each computation based on date and time and it is shown in both windows when the computation is completed. In order to not overwrite the output files, in some computers users should wait 60 seconds since the start of the previous computation before to run again the program. The header of the Report can be customized by editing the first 5 lines (max 80 characters) of the file header.txt . Roadpollution also produces the file outdat_roadpoll_xxxx.doc which contains data tables like the distributions on the road surface of luminance, horizontal, semicylindrical and vertical illuminance, veiling luminance, glare ratio, etc. In spite of their .doc extensions, these output files are in normal text format (txt) and can be opened with any word processor like Notepad, Wordpad, Word. Other output files are described in next sections.
The most interesting parametersThe report of Roadpollution contains a large number of parameters. Here I will resume the most interesting ones, some of which are frequently neglected in the usual lighting design practice. In the next paragraph an example of Report is shown with the described parameters emphasized in red. A proper minimization of light pollution requires that (1) the light reflected by lighted surfaces be limited to the necessary by avoiding overlighting, (2) the upward light emission by the luminaires be minimized, (3) the downward light emission wasted by the luminaire outside the road surface be minimized as much as possible so that the light reflected needlessly from these surfaces be minimized too. One of the first rules for minimizing light pollution and maximizing energy saving is to not over-light. Hence firstly it should be checked that the average maintained luminance of the road surface is both not lower than the level required by safety rules for that road class and not higher than it. A luminance higher than the necessary means that more energy than necessary is consumed and more light pollution than necessary is produced by the light reflected from the road surface. This is always explicitly required by a good law against light pollution (e.g. the majority of the regional laws in Italy prescribe it). For some kind of installations, like e.g. pedestrian areas, safety rules refers to the maintained illuminance rather than to the luminance, so this one will be the parameter to be checked. If the luminance or the illuminance are larger, the lighting design should be revised. In countries where laws against light pollution prescribe the use of flux controllers to reduce luminance/illuminance after curfew time, they can be also used for small adjustments of the luminance/illuminance before curfew (let’s say under 10 per cent). In order to check the energy saving capabilities of a lighting installation, fundamental quantities are the installed lamp flux per unit length per unit luminance and the installed lamp flux per unit area per unit luminance (also called photometric efficacy). The first is useful for comparing more installations on the same road and the second is better for comparing installations on roads of different width. These quantities should be as small as possible. Good installations with full-cut-off fixtures are expected to arrive under 300 klm/km per cd/m^2 and 40 lm/cd, with best reported values down to 200 klm/km per cd/m^2 and 25-30 lm/cd respectively. If the photometric efficacy is too large, a fundamental parameter to recognize the causes is the utilance or used fraction of the luminaire flux , which gives direct information on the quantity of light that the lighting design makes to be sent on the road surface and outside of it. The reduction of the light wasted outside the road, i.e. the maximization of the utilance, not only is the more effective way to reduce energy consumption but also allows to reduce the unuseful light pollution produced by the light reflected by those surfaces which should not be lighted. The fixture efficiency (fraction of lamp light which is actually emitted) is a less important parameter because a fixture could be poorly efficient but it could be able to send a greater fraction of light on the road surface whereas a more efficient fixture could waste a lot of light outside the road. However, a look to the calculated downward light output ratio DLOR (downward fixture efficiency) it is worth. It is unlikely that a fixture with downward efficency under the common range 65-80 per cent will allow a lighting design with a good photometric efficacy. The utilization factor (utilance times the fixture efficiency, expressed as fraction) is another useful parameter but it mixes the utilance which depends on the lighting installation design with the fixture efficiency which depends on the fixture choice. It is preferable to analyze them separately. The lamp efficacy gives another important information related to the energy saving. It should be the larger available for the lamp class required by the kind of lighting. Roadpollution calculates it from the Eulumdat data file. If the lighting installation uses a similar or analogue lamp but not exactly the same one, the efficacy could be different. Responsible user should verify this before using this information. The product of the photometric efficacy times the lamp efficacy gives the power per unit length per unit luminance or the power per unit area per unit luminance (sometimes called power efficacy or energetic efficacy). Even if these could seems more meaningful parameters, usually it is more useful to evaluate separately the photometric efficacy and the lamp efficacy because the first strictly depends on the lighting design whereas the second depends on the lamp choice. The lighting designer should obtain the best for each of them. The power efficacy could become important in some comparisons like e.g. if we have to compare an installation with low poles, large spread fixtures and low power lamps with another with high poles, narrow spread fixtures and higher power lamps. In this case the photometric efficacy is not sufficient for a correct comparison because the lamp efficacy changes with the power of the lamp. Like before, it is necessary to verify the actual lamp efficacy before using these parameters. A parameter not related to the energy expense but to the expenses for installation and maintenance is the number of luminaire per unit road length (luminaires per km). It is less important than the photometric efficacy because usually a larger energy saving should be preferred to a smaller number of luminaires. In facts a larger energy saving usually pays off a larger installation expense in a fraction of the lifetime of the lighting installation. A look to the threshold increment TI and to the glare rating GR give informations on the care that the lighting designer devoted to the control of the disturb produced by the glare. Maximum TI should be under 10 or 15 depending on the kind of road and maximum GR under 55 for pedestrian ways. Refer to technical rules for specific values. The light pollution produced by artificial light emitted upward from the fixtures of a light installation depends on the direction of emission of the light. Emissions at lower gamma, nearest to the horizon plane, are particularly effective in producing the adverse effects of light pollution because propagates more and adds efficiently. Integrated parameters are then poorly useful. A good way to investigate the light pollution by direct upward emission from the fixtures of a lighting installation is to look at the table of the Upward intensity per unit luminaire flux (cd/klm). It gives for a sample of directions, defined by elevation alpha and azimuth omega, the upward intensity of the luminaire emission per unit flux emitted by the luminaire. For comparison the emission of the road surface calculated assuming dark asphalt reflectivity is also shown, together with the ratio between the first and the second. We could consider “minimized” the unnecessary upward emission by luminaires when it is smaller than 10% of the road emission (assuming that the road is not over-lighted). Hence the ratio should be less than 0.1 in particular at low elevations. The maximum luminaire intensity per unit luminaire flux allows checking if the installation is compliant with the limit required by a law against light pollution, if any. Regional laws in some regions of Italy adopt a limit of 0.49 cd/klm at gamma equal or larger than 90 degrees for almost any kind of installation with few exceptions. Users should verify if the limit to comply with is an intensity per unit luminaire flux or an intensity per unit lamp flux. The first quantity is the second divided by the fixture efficiency (LORL, light output ratio of the luminaire). The first quantity is the one which make sense in limiting light pollution and it is usually adopted. In few cases (e.g. regional laws of Lazio and Campania in Italy) limits enforced are different in different ranges of gamma angles. In this case the compliance of the installation with the law should be checked by manual inspection of the photometrical data. When the fixture tilt is zero, it is sufficient to look at the Eulumdat file (dividing per unit lamp flux data by the LORL if limits are given per unit luminaire flux). When the fixture is tilted, Roadpollution provides two specific files for this purpose. Rotatedphot_ provides the intensities of the inclined luminaire, both per unit lamp flux and per unit luminaire flux, interpolated on the grid of angles C, gamma. It allows to recognize rapidly if in some directions the limit is surpassed. When the limit is surpassed for a small quantity, the possible uncertainty due to the interpolation cannot be neglected and the file Rotatedangles should be used instead. It provides the original photometry, both per unit lamp flux and per unit luminaire flux, together with the angles C, gamma before and after the inclination of the fixture. In this case the data are irregularly distributed on the grid but there is no risk of interpolation error. Finally, even if integrated quantities are usually not effective to evaluate light pollution, it could be interesting have a look to two of them, more appropriate than the obsolete upward light flux ratio (UFR). The upward scattered flux factor and the low-angle upward scattered flux factor give the fraction of luminaire flux, in percent, which is emitted upward and is scattered by molecules and aerosols along its path in a standard clean atmosphere. The first factor is computed on the entire upper hemisphere and the second, more interesting, at low angles over the horizon (in the range of gamma 90-120 degrees) where light pollution is particularly propagative and additive. It is interesting compare these factors for (a) the direct emission by fixtures (pollution to be minimized) and (b) the reflection by surfaces lighted from wasted light (pollution to be minimized) with the factors for the road surface (the only truly necessary pollution). The increase of scattered flux due to direct emission and the increase of scatter flux due to out-of-road light reflection over the scattered flux due to reflection from the road surface should be always under 10 per cent, both in the emispheric and in the low-angle case. It should be recognized, however, that the light wasted on the surfaces surrounding the road, and their consequent light reflection, are very difficult to control so much. This is the reason because laws against light pollution so far do not limit quantitatively the intensity per unit of luminaire flux due to reflection from surfaces which should not be lighted.
Example of ReportHere below a typical report is shown. The most interesting parameters described in the previous section are emphasized in red and the customizable header in blue.
Istituto di Scienza e Tecnologia dell'Inquinamento Luminoso
via Roma 13, 36016 Thiene, Italy
tel +39 0445 381899
Dr. Pierantonio Cinzano
----------------------------------------------------------------
REPORT
Analysis of the environmental impact of light pollution from a road lighting installation
---------------------------------------------------------------- Creator:
ROADPOLLUTION, software for the evaluation of the environmental impact of light pollution from road lighting and the analysis of lighting installations
copyright 2002,2005 Pierantonio Cinzano, Thiene www.lightpollution.it/roadpollution/
----------------------------------------------------------------
Date 20051001 Time 0155 Filename report_roadpoll_200510010155.doc
---------------------------------------------------------------- Input installation data:
lamp flux (klm) 6.500 road width (m) 7.0 luminaire spacing (m) 22.0 luminaire overhang (m) 2.5 luminaire height (m) 7.0 luminaire tilt (deg) 0.0
---------------------------------------------------------------- Input surface:
CIE Standard C2 Data file SRT_C2
---------------------------------------------------------------- Input luminaire:
Luminaire input data file eulumda2.ldt
Test ityp 3 isym 4 C samples 36 C delta 10.00 Gamma samples 37 Gamma delta 5.00
Conversion factor for luminous intensities CFLI 1.0000 Tilt angle during measurements (deg) 0.00
Number of lamp sets 1 type of lamp HQL 250W total flux (lm) 13000 wattage (including ballast) 265 Maximum measured gamma 180
---------------------------------------------------------------- Luminaire emission data from Eulumdat file (std. position):
Downward flux factor DFF % 98.00 Upward flux factor UFF % (UFR, Rn) 2.00 Light output ratio of the luminaire LORL % 73.00 Downward light output ratio DLOR % 71.54 Upward light output ratio ULOR % 1.46
---------------------------------------------------------------- Luminaire emission data (calculated):
Downward flux factor DFF % 97.80 Upward flux factor UFF % (UFR, Rn) 2.20 Light output ratio of the luminaire LORL % 71.10 Downward light output ratio DLOR % 69.54 Upward light output ratio ULOR % 1.57
---------------------------------------------------------------- Grid data:
adopted grid UNI 10439 (Italy) luminaire spacing (m) 22.00 luminaire spacing ratio (m) 3.14 luminaire tilt for computation (deg) 0.00 road width (m) 7.00 grid points along X 10 grid points along Y 10 grid dX (m) 2.20 grid dY (m) 0.70 points along X start at border first/last grid point x= 0.0, x= 19.80 points along Y start at half cellsize from the border first/last grid point y= 0.35, y= 6.65 luminaire at x=0.0, y= 2.50 observer 1 at z= 1.50, x=-60.00, y= 1.75 observer 2 at z= 1.50, x=-60.00, y= 5.25
---------------------------------------------------------------- Road lighting parameters:
Lamp flux maintenance factor q 0.80
observer at infinity average maintained luminance L_ave (cd/m^2): 1.07
observer 1 maintained luminance L (cd/m^2): average: 1.01 rms: 0.39 minimum: 0.36 maximum: 1.88 overall uniformity U_0 (min/ave): 0.36 lengthwise uniformity U_L: 0.62
observer 2 maintained luminance L (cd/m^2): average: 1.02 rms: 0.37 minimum: 0.40 maximum: 1.84 overall uniformity U_0 (min/ave): 0.40 lengthwise uniformity U_L: 0.69
maintained horizontal illuminance E (lx): average: 12.89 rms: 2.96 minimum: 6.93 maximum: 17.93 min/ave: 0.54 min/max: 0.39
average luminance per unit illuminance)(cd/lm) (luminance coefficient) at infinity: 0.083 observed: 0.078 average illuminance per unit luminance K (lx/cd/m^2) at infinity: 12.07 observed: 12.83
veiling luminance on the road (cd/m^2): maximum: 0.22 average: 0.09 minimum: 0.05
threshold increment TI %: maximum : 10.75 maximum R: 10.75 maximum L: 8.68
glare rating index GR: maximum: 40.44 average: 30.85 minimum: 24.41
maintained semicilindrical illuminance Esc (lx): minimum: 0.80 average: 5.15 maximum: 11.59
maintained vertical illuminance Ev (lx): minimum: 0.89 average: 7.60 maximum: 18.21
maintained hemispherical illuminance Ehs (lx): minimum: 5.11 average: 8.20 maximum: 10.69 min/ave: 0.62
---------------------------------------------------------------- Energy and cost parameters:
utilization factor (flux on the road/lamp flux): 0.382 used fraction of the luminaire flux %: 53.69 wasted fraction of the luminaire flux %: 46.31 used fraction of the downward flux %: 54.90 wasted fraction of the downward flux %: 45.10
luminaires per km: 45.45 installed lamp flux per unit length (klm/km): 295.45 installed lamp flux per unit area (lm/m^2): 42.21
installed lamp flux per unit length per unit luminance initial (klm/km)/(cd/m^2) : 233.94 maintained (klm/km)/(cd/m^2): 292.42 installed lamp flux per unit area per unit luminance (initial photometric efficacy, lm/cd) : 33.42 (maintained photometric efficacy, lm/cd): 41.77
installed power per unit length per unit luminance (kW/km)/(cd/m^2): 5.96 installed power per unit area per unit luminance (energetic efficacy, W/cd): 0.85 evaluated for lampHQL 250W with lamp efficacy (including ballast) 49.1 lm/w
---------------------------------------------------------------- Light Pollution, direction dependent parameters:
Average maintained luminance at azimuth omega Azimuth (deg) luminance (cd/m^2) 0 1.068 10 0.852 20 0.682 30 0.600 40 0.554 50 0.524 60 0.504 70 0.493 80 0.488 90 0.486 100 0.488 110 0.493 120 0.504 130 0.524 140 0.553 150 0.599 160 0.679 170 0.842 180 1.055 190 0.979 200 0.789 210 0.669 220 0.603 230 0.562 240 0.535 250 0.520 260 0.512 270 0.509 280 0.512 290 0.520 300 0.535 310 0.562 320 0.604 330 0.670 340 0.791 350 0.984
Upward intensity per unit luminaire flux (cd/klm) at elevation alpha and azimuth omega alpha(deg) omega(deg) road intensity fixture intensity ratio% 1 0 0.78 12.86 1656 10 0 7.72 15.47 200 20 0 15.21 12.66 83 30 0 22.24 7.03 31 1 30 0.44 10.94 2508 10 30 4.34 8.44 194 20 30 8.55 5.63 65 30 30 12.50 4.22 33 1 60 0.37 5.46 1490 10 60 3.65 4.22 115 20 60 7.18 2.81 39 30 60 10.50 2.81 26 1 90 0.35 5.69 1608 10 90 3.52 7.03 199 20 90 6.93 2.81 40 30 90 10.13 2.81 27 1 120 0.37 5.46 1490 10 120 3.65 4.22 115 20 120 7.18 2.81 39 30 120 10.50 2.81 26 1 150 0.44 10.94 2514 10 150 4.33 8.44 194 20 150 8.53 5.63 65 30 150 12.47 4.22 33 1 180 0.77 12.86 1677 10 180 7.63 15.47 202 20 180 15.02 12.66 84 30 180 21.96 7.03 32 1 210 0.49 10.94 2249 10 210 4.84 8.44 174 20 210 9.54 5.63 58 30 210 13.94 4.22 30 1 240 0.39 5.46 1404 10 240 3.87 4.22 109 20 240 7.62 2.81 36 30 240 11.14 2.81 25 1 270 0.37 5.69 1538 10 270 3.68 7.03 191 20 270 7.25 2.81 38 30 270 10.59 2.81 26 1 300 0.39 5.46 1404 10 300 3.87 4.22 109 20 300 7.62 2.81 36 30 300 11.15 2.81 25 1 330 0.49 10.94 2246 10 330 4.85 8.44 174 20 330 9.55 5.63 58 30 330 13.96 4.22 30
Average upward intensity per unit luminaire flux at elevat. alpha alpha average road intensity fixture intensity ratio% 1deg 0.46 8.81 1910 10deg 4.59 7.66 166 20deg 9.04 5.39 59 30deg 13.22 4.45 33
Maximum upward luminaire intensity per unit lamp flux 11.00 cd/klm at angles C, gamma 0, 100 per unit luminaire flux 15.47 cd/klm at angles C, gamma 0, 100
Maximum upward road intensity (estimate) per unit lamp flux 18.79 cd/klm at gamma 180 deg per unit luminaire flux 26.43 cd/klm at gamma 180 deg
---------------------------------------------------------------- Light Pollution, integrated parameters:
reference out-of-road surfaces calculated for: lambertian reflectance with rho=0.135 in average
direct upward flux ratio UFR % (Rn%): 2.20 road reflected upward flux ratio %: 6.39 (road reflected upward flux ratio for aged asphalt%: 6.24) out-of-road reflected upward flux ratio %: 5.95 increase of upflux ratio due to direct emission % 34 increase of upflux ratio due to out-road emiss. % 93
direct unit uplight density DUUD (lm/m^2): 0.66 road unit uplight density RUUD (lm/m^2): 1.92 out-of-road unit uplight density WUUD (lm/m^2): 1.79 increase of uplight density due to direct emission %: 34 increase of uplight density due to out-road emiss. %: 93
---------------------------------------------------------------- Light Pollution, emispheric and low-angles scattering parameters
direct scattered flux factor % 1.64 road scattered flux factor % 3.26 out-of-road scattered flux factor % 3.04 increase of scattered flux due to direct emiss. % 50 increase of scattered flux due to out-road emiss.% 93
low-angles direct upward flux factor % 2.08 low-angles road upward flux factor % 2.09 low-angles out-of-road upward flux factor % 1.95 increase of low-angles upward flux due to direct emission % 99 increase of low-angles upward flux due to out-road emission % 93
low-angles direct scattered flux factor % 1.56 low-angles road scattered flux factor % 1.24 low-angles out-of-road scattered flux factor % 1.16 increase of low-angles scattered flux due to direct emission % 125 increase of low-angles scattered flux due to out-road emiss. % 93
---------------------------------------------------------------- One of the tables contained in the file outdat_roadpoll_xxxx.doc is visible below as an example. Maintained Observed Luminance (cd/m^2) observer 1 y/x 0.00 2.20 4.40 6.60 8.80 11.00 13.20 15.40 17.60 19.80 6.65 0.37 0.36 0.43 0.44 0.45 0.49 0.44 0.48 0.48 0.39 5.95 0.46 0.46 0.54 0.54 0.57 0.64 0.57 0.59 0.60 0.48 5.25 0.56 0.58 0.69 0.69 0.75 0.83 0.75 0.72 0.76 0.59 4.55 0.68 0.74 0.88 0.91 0.99 1.08 1.00 0.90 0.92 0.75 3.85 0.84 0.94 1.14 1.18 1.31 1.41 1.32 1.12 1.10 0.91 3.15 1.04 1.20 1.44 1.50 1.64 1.76 1.58 1.32 1.27 1.08 2.45 1.15 1.30 1.58 1.66 1.80 1.88 1.75 1.38 1.37 1.14 1.75 1.09 1.26 1.50 1.56 1.66 1.76 1.59 1.33 1.29 1.10 1.05 0.89 1.01 1.20 1.25 1.36 1.44 1.32 1.13 1.11 0.92 0.35 0.70 0.77 0.92 0.95 1.03 1.10 1.00 0.91 0.92 0.75 Input e Output filesIn addition to the Eulumdat files with the photometrical data and to the roadpollution.exe file, the directory roadpollution contains a number of input files, some of which should not be modified by the user. Roadpollution also produces a number of files in addition to the report and outdat files. The tables below list the input and output files.
DocumentationThe reference of this user manual is: [1] Cinzano, P. 2005, Roadpollution User Manual, ISTIL Int. Report 11, ISTIL, Thiene A description of many parameters in the Report can be found in the following document (note that it refers to an old command-line version and many parts have been updated, including road reflection calculation and 3D plotting): For general informations about the effective limitation of light pollution read the paper: Some computational techniques and formulae used in Roadpollution are described in the following documents: [4] CIE Publ. 140 - 2000, Road lighting calculations [5] EN 13201-3 (2003), Road lighting - Part 3: Calculations of performance [6] UNI 10439 (2001), Requisiti illuminotecnici delle strade con traffico motorizzato [7] ANSI IESNA RP-8-00 (2000), Roadway Lighting [8] CIE S015-E (2005), Lighting of work places - outdoor work places [9] Garstang R. H., 1986, Model for artificial night-sky illumination, Publ. Astron. Soc. Pacific, 98, 364-375 A case study made with the first version of Roadpollution is also available: [10] Cinzano, P., Light pollution by luminaires in roadway lighting, paper presented at the CIE TC4-21 (Interference of light on the astronomical observations), CIE Div.4 meeting, Turin, 28 September - 3 October 2002. See also the slide presentation.
Further informations will be published in the FAQ.
DisclaimerRoadpollution is available “as is”. The user uses it at his own risk. In case of professional applications the user should check by himself the accuracy of the results. This is a preview beta version and it is likely not bug-free. It is a by-product of the author’s research activity and no support can be offered. The software was checked with Norton Antivirus before uploading to the web server.
Bug reports and suggestionsBug reports and suggestions can be sent to
|
|||||||||||||||||||||||||||||||||||||
|
©2005-2006 Pierantonio Cinzano, Thiene, Italy |
 I
I