Copyright 2000, P. Cinzano, Thiene, Italy
All rights reserved
Growth of light pollution in Italy
A comparison between the maps of the artificial night sky brightness in Italy obtained in year 1971 by Bertiau, Treanor and De Graeve (1973) with maps obtained in year 1998 with the same method, but based on satellite data, shows an average growth of the night sky brightness in Italy of a factor 7 in the period 1971-1998 (Falchi 1998; Falchi, Cinzano, Elvidge 2000). This is in agreement with the magnitude order of the growth obtained from archive measurements collected by Cinzano (2000, figure at bottom), which suggest an exponential growth with an yearly growth rate of 10 per cent in the Veneto Plane between year 1965 and 1996.
The figure shows the growth of light pollution in Italy. At left the map of artificial sky brightness in 1971 (Bertiau, Treanor, De Graeve 1973); at centre our map calibrated to 1998; at right a possible scenario of the artificial sky brightness in 2025 if no countermesures are undertaken. We compared Bertiau map with a map obtained with satellite data using the same propagation law used by them (Treanor law), we determined the average growth from 1971 to 1998 and then we rescaled our map of 1998 to 2025 assuming the same growth. The map does not take into account the effects of laws against light pollution enforced in many Italian regions.
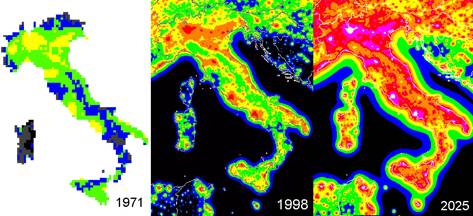
Growth of light pollution in Italy.
This figure is copyright but may be reproduced by the press in articles citing our research with the following credit/copyright statement: P. Cinzano, F. Falchi, C. D. Elvidge. Copyright 2001 ISTIL, Thiene. Reproduced from ISTIL Report 2001.
Levels correspond to a fraction of a reference natural sky brightness (251 ucd/m^2):
| map 1971 (Bertiau et al.) |
map 1998 |
map 2025 |
|||||
<5% |
black |
<11% |
black | <11% |
black | ||
16-35% |
blue |
11-33% |
blue |
11-33% |
blue |
||
36-110% |
green | 33-100% |
green | 33-100% |
green | ||
>1.1 |
yellow | 1-3 |
yellow | 1-3 |
yellow | ||
|
|
3-9 |
orange | 3-9 |
orange | ||
|
|
>9 |
red | 9-27 |
red | ||
|
|
27-81 |
violet | ||||
|
|
>81 |
white | ||||
Yellow indicates an artificial sky brightness equal to the natural (so the total is double). Orange corresponds approximately to areas where the Milky Way is very difficult to see. At sea level, where the majority of the population lives, the Milky Way could be mostly invisible from Italy in 2025. Red corresponds to areas where less than a hundred of stars is visible from the zenith to 30 degrees elevation.
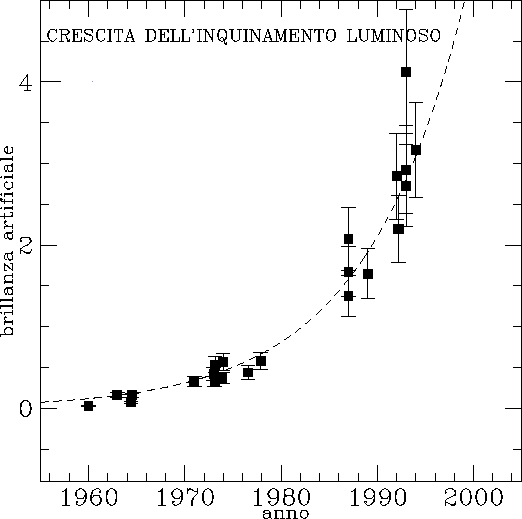
The growth of the artificial sky luminance in the Veneto plane (Italy) from archive measurement of sky brightness at Asiago Astrophysical Observatory and Ekar Astronomical Observatory (Cinzano 2000).