Istituto di Scienza e Tecnologia dell'Inquinamento Luminoso
Light Pollution Science and Technology Institute
The night sky in the WorldSatellite monitoring of the artificial night sky brightness and the stellar visibility |
Maps of Artificial Night Sky Brightness
The maps of the artificial night sky brightness at zenith at sea level allow to compare levels of light pollution in the atmosphere, to recognize more and less polluted areas and to identify the more polluting districts and the bigger sources.
These maps are intended to show the levels of pollution in the atmosphere rather than the stellar visibility which is the aim of the other maps described afterwards. The assumption of sea level and standard clear atmospherical conditions allows to compare pollution of different areas, to recognize more polluting sources or darker areas (areas with less light in the atmosphere and not areas where you see better the stars) without be confused by the altitude effects.
However you do not see a big difference accounting for altitude (e.g. in correspondence of Mount Ekar, at the borders of the padana plane, rising from sea level to 1350 m of elevation the artificial sky brightness diminishes less than about 20% whereas color levels in our maps shows each one three times larger brightness than the previous one.)
These maps do not give information on the star visibility, however mainly polluted areas usually are at sea level, so very approximately we can say that the orange level in our standard scale indicates areas where the milky way is invisible or quite difficult to see by an average observer in normal clear nights. The red areas indicates zones where very approximately one hundredth of stars, or few more, is visible over 30 degrees of elevation. Blue border indicates artificial sky brightness over 10% than the natural brightness which is the definition of "light polluted sky". Yellow indicates an artificial sky brightness equal to the natural so that the total sky brightness is doubled.
Maps show the artificial sky brightness at the zenith in clean nights in V band, obtained by integration of the contributions produced by every surface area in the surroundings of the site. Each contribution is computed taking into account based on Garstang models the propagation in the atmosphere of the upward light flux emitted by the area and measured by the Operational Linescan System of US Air Force DMSP satellites. We account for extinction along light paths, double scattering of light from atmospheric molecules and aerosols, Earth curvature and aerosol content of the atmosphere.
This technique is described in detail in Cinzano, Falchi, Elvidge (2000) published on Monthly Notices of the Royal Astronomical Society, 318, 641-657
The figures of this page are copyright of the Royal Astronomical Society. See the World Atlas pages for the Guidelines on the reprint of the maps. Write for reprint permission of the other maps.
Artificial Night Sky Brightness in the World
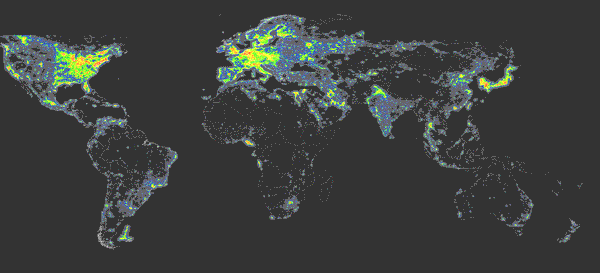
See The World Atlas of sea level artificial night sky brightness for maps of individual continents.
For details on the technique and statistic tables see Cinzano, P., Falchi, F., Elvidge C.D. 2001, The first world atlas of the artificial night sky brightness, accepted for publication in Monthly Notices of the Royal Astronomical Society.
Artificial Night Sky Brightness in Europe
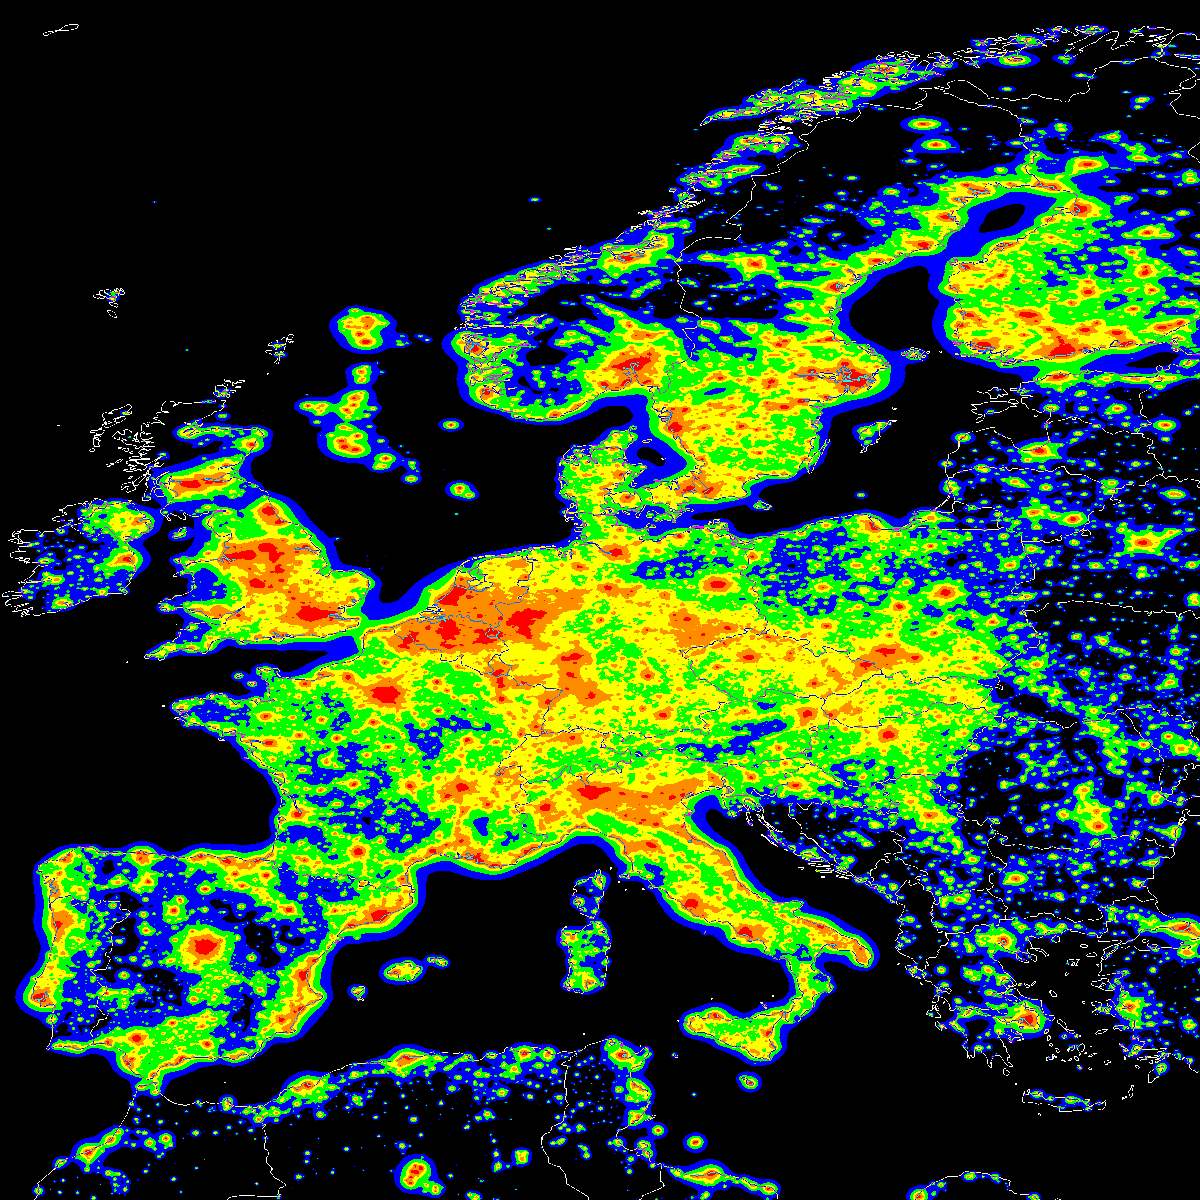
Clik on the image to get larger
Colours correspond to ratios between the artificial sky brightness and the natural sky brightness of: <0.11 (black), 0.11-0.33 (blue), 0.33-1 (green), 1-3 (yellow), 3-9 (orange), >9 (red).
Download original colour figures in zipped
TIFF format from the paper Cinzano, P., Falchi, F.,
Elvidge C.D. 2000, Monthly Notices of Royal Astronomical Society, 318,
641-657
Europe west V band 432 KB (11MB after unzip)
Europe east V band 597 KB (11MB after unzip)
Europe west B band 464 KB (11MB after unzip)
Europe east B band 638 KB (11MB after unzip)
Artificial Night Sky Brightness in Italy
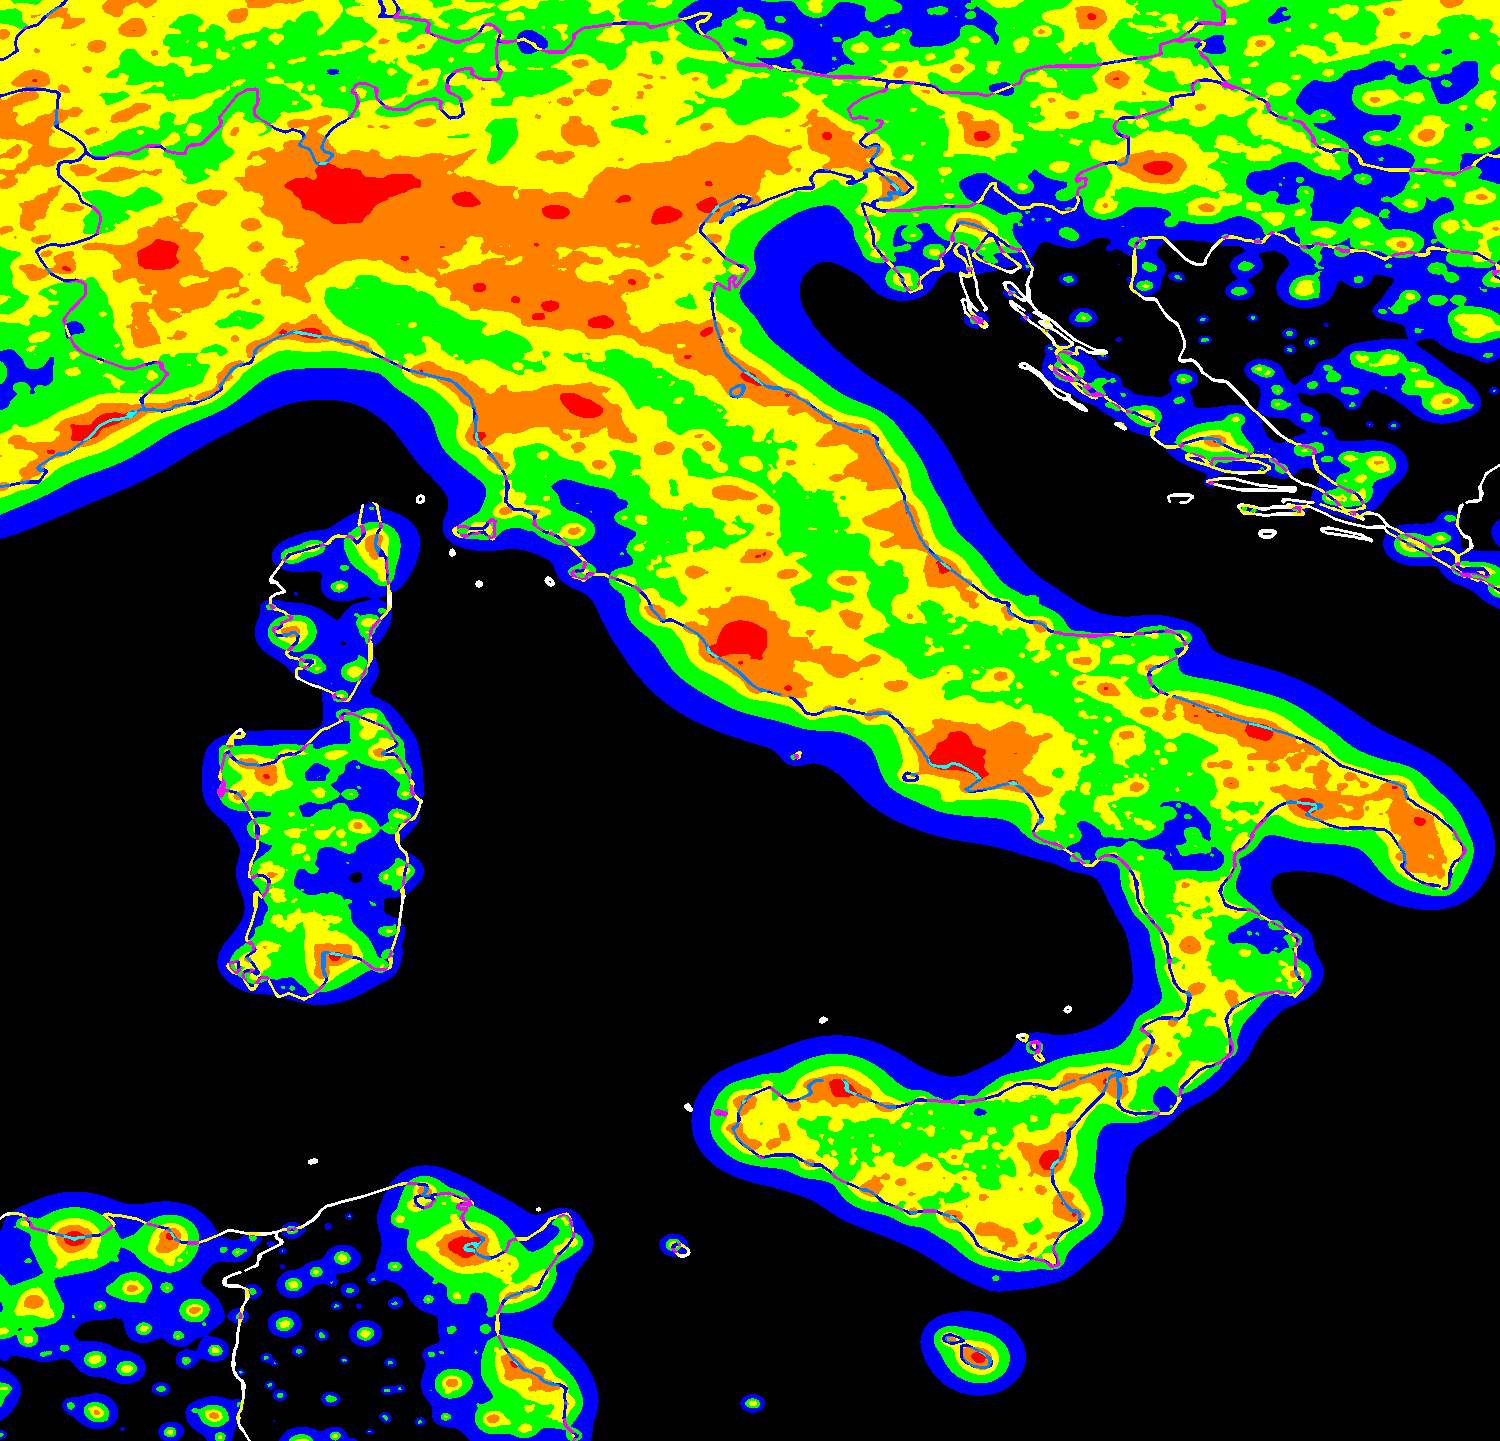
Clik on the image to get larger
Colours correspond to ratios between the artificial sky brightness and the natural sky brightness of: <0.11 (black), 0.11-0.33 (blue), 0.33-1 (green), 1-3 (yellow), 3-9 (orange), >9 (red).