Istituto di Scienza e Tecnologia dell'Inquinamento Luminoso
Light Pollution Science and Technology Institute
The night sky in the WorldSatellite monitoring of the artificial night sky brightness and the stellar visibility |
Maps of the naked eye stellar visibility
The maps of the stellar visibility (naked eye limiting magnitude) show the capability of the population to see the stars. They usually are computed at zenith, accounting for the extinction of the star light in the atmosphere from the top of the atmosphere to the observer and the eye capability to detect point sources over a light background. They are unsuitable to evaluate the light pollution of the atmosphere because the elevation and extinction of the light confuse the behaviour.
As an example, the mountains near the top of the image below could appear unpolluted because they show the same limiting magnitude than unpolluted zones of the sea at lover left corner. However the stellar extinction from an elevated site is less than from sea level and the number of particles and molecules which can scatter the artificial light is less too, so limiting magnitude and stellar visibility increase with elevation. In conclusion the similar limiting magnitude in the mountains and in the unpolluted areas of the sea means that the mountains are polluted SO MUCH that the stellar visibility there is comparable with the visibility from sea level.
As Blackwell (1946) and many other authors showed, the relation between limiting magnitude and sky brightness is not linear and, moreover, it is a statistical concept. A number of random factors affect eye measurements (Garstang 2000; Schaefer 1991) like the individual eye capability, the individual pupil size, the experience that makes the observer confident of a detection at a probability level different from another, the duration of the observation and so on. So we can predict only the star visibility by an average observer even if we account for many details (e.g. observer pupil diameter depending on the age; Stiles-Crawford effect (a decrease of the efficiency in detecting photons with the distance from the centre of the pupil); colour differences between the laboratory sources and the observed star; colour differences between the laboratory sources and the night sky; differences between the night vision curve and the V band in computing the stellar extinction.
Naked eye star visibility in Europe in V mag.
The
figure shows the centre of the gaussian distribution of the naked eye limiting
magnitude in Europe at the zenith.
Levels correspond to V magnitudes:
|
>6.0
|
black
|
|
5.75-6.0
|
grey
|
|
5.5-5.75
|
blue
|
|
5.25-5.5
|
light
blue |
|
5.0-5.25
|
azure
|
|
4.75-5.0
|
yellow
|
|
4.5-4.75
|
golden
yellow |
|
4.25-4.5
|
orange
|
|
4.0-4.25
|
dark
orange |
|
3.75-4.0
|
red
|
|
<3.75
|
violet |
from
This map is copyright of the Royal Astronomical Society.
Reproduction Guidelines for use of this image.
Maps of the loss of naked eye limiting magnitude
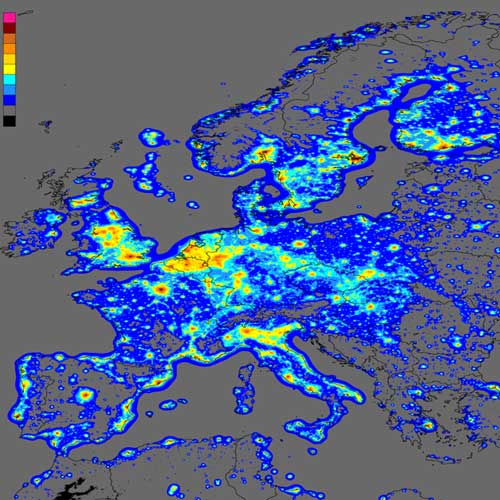
The maps of the loss of naked eye limiting magnitude show the loss of the capability of the population to see the stars. They are obtained simply by the difference between the map of the star visibility and a map of the same quantity evaluated assuming no light pollution in the area. The difference with the previous map is that in this case the effects of the light pollution are clearly visible but these maps are less useful to find the best observative sites.
Naked eye magnitude loss in Europe in V mag.
This map is copyright but may be reproduced by the press in articles citing our research with the following credit/copyright statement: "P. Cinzano, F. Falchi (University of Padova), C. D. Elvidge (NOAA National Geophysical Data Center, Boulder). Copyright 2001 ISTIL, Thiene. Reproduced from www.lightpollution.it."
The loss of naked eye limiting magnitudes are computed for observers of average experience and capability, aged 40 years, with the eyes adapted to the dark, observing with both eyes toward the zenith. Download the full resolution zipped TIFF image.
Levels correspond to magnitude loss (in V mag.):
|
<0.1
|
black
|
|
0.1-0.2
|
purple |
|
0.2-0.4
|
orchid |
|
0.4-0.6
|
blue |
|
0.6-0.8
|
light blue |
|
0.8-1.0
|
green |
|
1.0-1.2
|
golden
yellow |
|
1.2-1.4
|
yellow |
|
1.4-1.6
|
orange |
|
1.6-1.8
|
red
|
|
1.8-2.0
|
hot pink |
|
>2.0
|
pink |