Istituto di Scienza e Tecnologia dell'Inquinamento Luminoso
Light Pollution Science and Technology Institute
The night sky in the WorldSatellite monitoring of the artificial night sky brightness and the stellar visibility |
Maps of the total night sky brightness
The maps of the the total night sky brightness show the quality of the night sky in the territory. They usually are computed at zenith, accounting for the elevation and the natural sky brightness. In smaller-size maps we also account for screening by mountain and terrain elevation.
The elevation has effect on the natural sky brightness, on
the artificial sky brightness and on the stellar extinction and is
obtained from a digital elevation map (DEM). The natural sky brightness
depends on the chosen direction of view and on the altitude and it is obtained
with
Garstang (1989) models which account for the light coming from the entire
sky and scattered along the line of sight of the observer and for the
given atmospherical conditions. The mountain
screening is obtained evaluating the elevation of each pixel
along the line which connect each site with each source and then computing
the maximum screening angle from which we determine the fraction of
the line of sight shielded. This is very time consuming, in particular if
the line of sight is not vertical and requires computation for each of its
points.
Darker areas (white color) looks slightly larger in these maps than in maps of artificial night sky brightness. This is an apparent effect due to the large interval of our colour levels (0.5 mag/arcsec^2) which do not show where the artificial sky brightness is a fraction of the natural one.
Total
night sky brightness in Europe accounting for altitude (in V mag/arcsec^2)
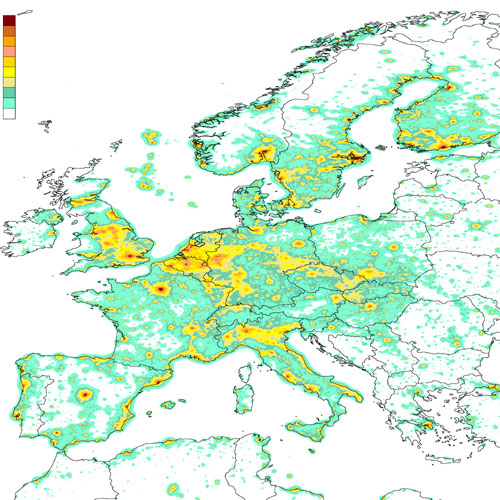
The figure shows the total sky brightness at the
zenith in V band. Download the full resolution zipped TIFF image.
From
This map is copyright of the Royal Astronomical Society.
Reproduction Guidelines for use of this image.
The map was computed for clean atmosphere with
aerosol clarity K=1, corresponding to a vertical extinction in V band of 0.33
mag at sea level (0.21 mag at 1000m o.s.l., 0.15
mag at 2000m o.s.l., horizontal
visibility at sea level 26 km.). The map was rescaled from 1996-1997 to
1998-1999 based on the fitting to observations. Each pixel is 30''x30'' in size
in longitude/latitude projection. Country boundaries are approximate. Mountain
screening was neglected.
Levels
correspond to total sky brightness of
V mag/arcsec2:
|
>21.5 |
white |
|
21-21.5 |
green |
|
20.5-21 |
dark
green |
|
20-20.5 |
kaki |
|
19.5-20 |
yellow |
|
19-19.5 |
dark
yellow |
|
18.5-19 |
pink |
|
18-18.5 |
orange |
|
17.5-18 |
maroon |
|
<17.5 |
dark
red |