
Istituto di Scienza e Tecnologia dell'Inquinamento Luminoso
Light Pollution Science and Technology Institute
The night sky in the WorldSatellite monitoring of the artificial night sky brightness and the stellar visibility |
Maps of the night sky in selected sites
Our computer programs calculate the artificial night sky brightness, the total night sky brightness and the star visibility (limiting magnitude) over the entire sky of any site of the World, based on the measurements of upward light flux made by DMSP satellites and the Garstang models for the propagation of the light in the atmosphere. The programs account for mountain screening, elevation, Earth curvature and atmospheric conditions. The method is described in detail in Cinzano P. (Dipartimento di Astronomia, Università di Padova), Elvidge C. D. (National Geophysical Data Center, Boulder) 2004, Night sky brightness at sites from DMSP-OLS satellite measurements, Monthly Notices of the Royal Astronomical Society, 353, 1107-1116. Here few sample of results:
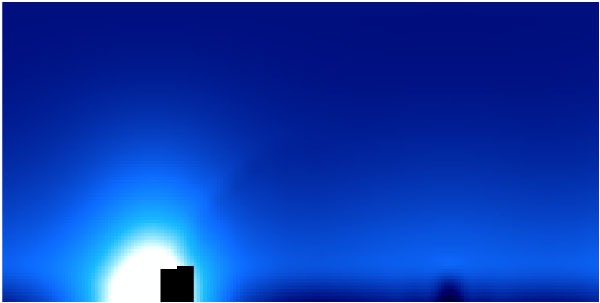
Fig.1 - A large screen shields part of the light at the right side of a source and produces a dark baffle. The umbra at left is produced by the "mountain" where the observer is assumed to be. (Images goes from 0 to 360 degrees in azimuth and from horizon to zenith in altitude, except where differently specified.)
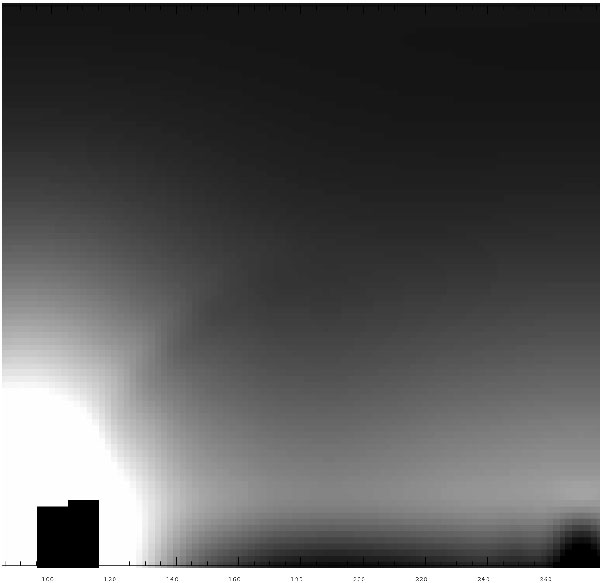
Fig.2 - An enlargement of the dark "baffle".
|
|
|
|
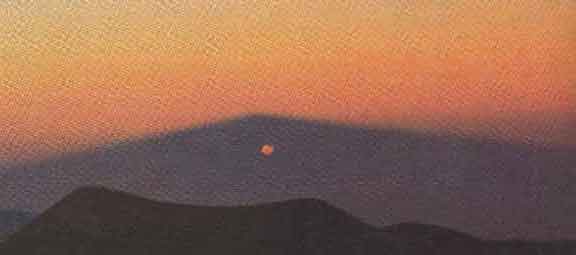
Fig.3 - Schaefer's Umbrae due to the screening produced by the Mauna Kea on the light of the rising sun backscattered to the observer. (Photo by Wynn-Williams in Schaefer, B.E., 1988, Sky and Telescope, 4, 416-418 and a model by Schaefer 1988). An asymmetric penumbra is visible at right.
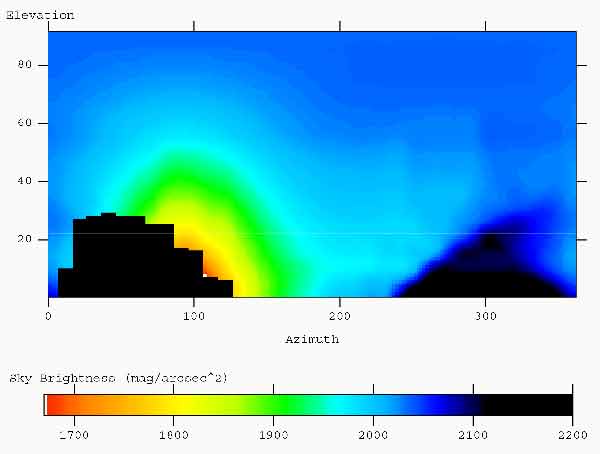
Fig.4 - This is an example of the analogous of the Schaefer's Umbrae produced by a source of light pollution instead of the Sun. A city screened by a large conic mountain (left) projects an umbra over the horizon (right). When the mountain is off-set in respect to the line observer-source, a non symmetric penumbra appears. Here the penumbra is at higher altitudes than in the Williams' photo likely because the observer is at much lower elevation.
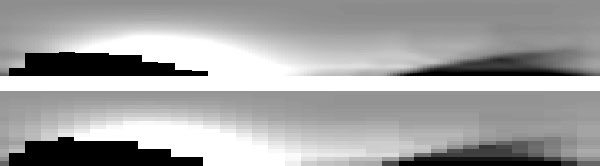
Fig.5 - These maps, flattened along the vertical axis, give a more realistic perception of the shape of the mountain umbra. (Upper panel: interpolated results.; lower panel: original results)
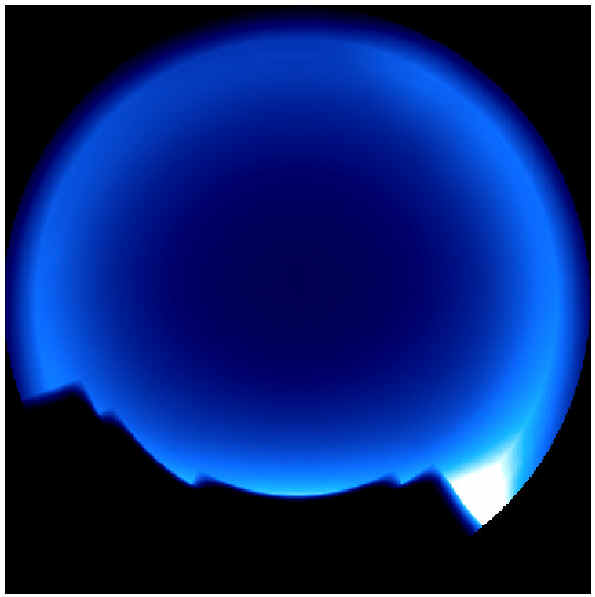
Fig.6 - Another example in polar coordinates of the effect on the night sky of a source shielded by an off-axis high mountain. In this case the natural sky brightness smooth the umbra which is hardly visible.
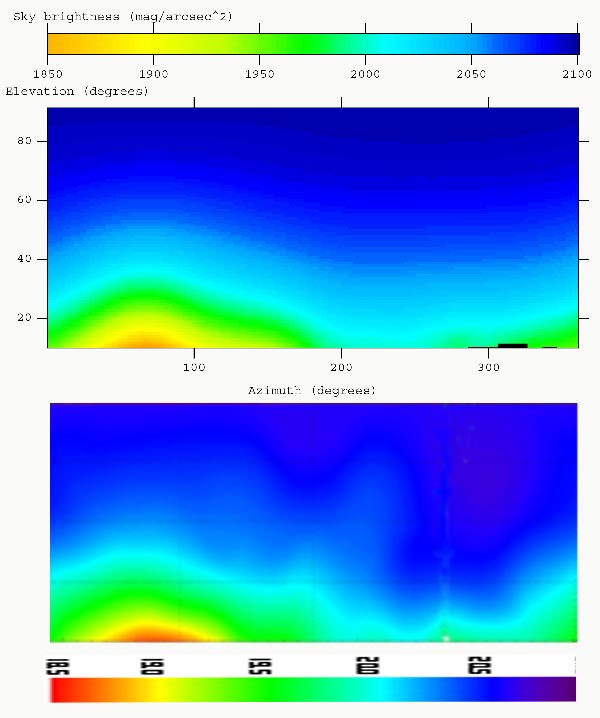
Fig.7 - First preliminary results for Test Site 1. The upper panel shows our predictions from satellite data and the lower panel shows the results of photometric measurements at the site (Catanzaro and Catalano 2000). The agreements is excellent. Main visible differences are due to the different colour scales obtained with two different analysis programs. A more accurate comparison is provided in figure 8 below. The top of a nearby mountain is visible in our prediction near 320 degrees of azimuth.
Fig.8 - Comparison between predictions and measurements in Test Site 1.